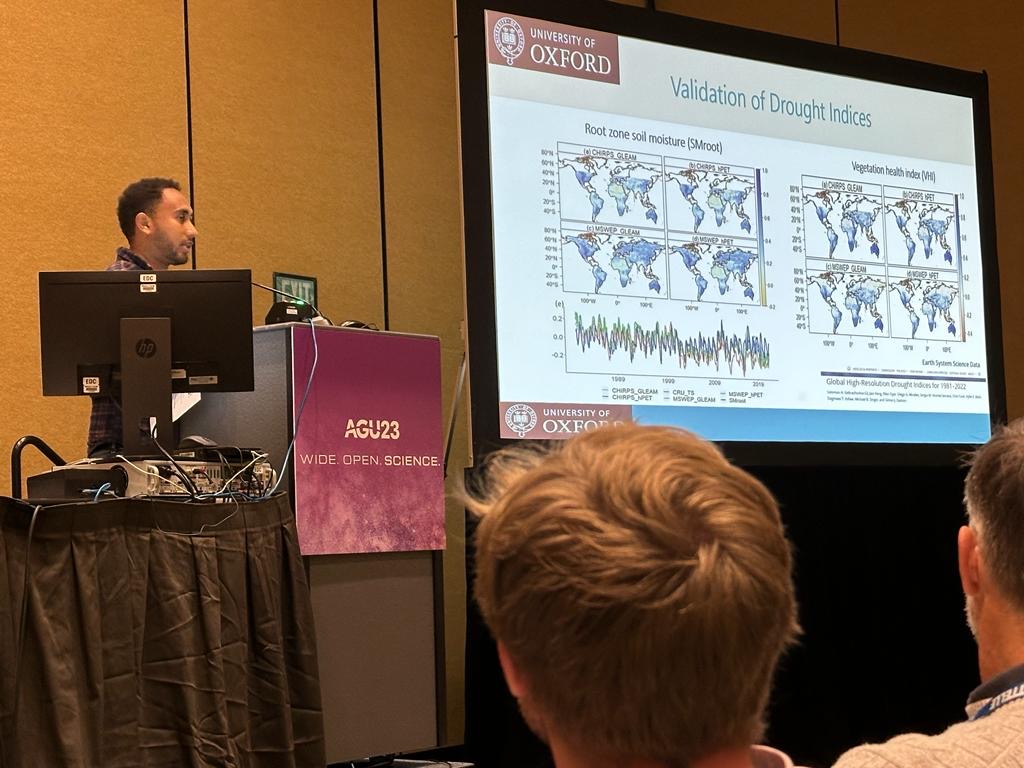
by Dr Solomon Gebrechorkos (University of Oxford) and Professor Simon Dadson (University of Oxford)
Drought is a complex natural phenomenon with profound impacts on ecosystems, agriculture, water resources, and society as a whole. Understanding drought patterns and trends is crucial for effective water resource management, agricultural planning, and disaster preparedness. In recent years, advancements in technology and data availability have enabled the development of high-resolution drought indices, providing researchers and decision-makers with unprecedented insights into drought dynamics at local and regional scales. In this blog post, we will explore the journey of developing and utilizing high-resolution drought datasets to unlock insights into drought patterns.
Part 1: The Development of High-Resolution Drought Datasets
High-resolution drought datasets are essential for quantifying the severity, duration, and frequency of droughts at a local scale and enabling the development of site-specific adaptation measures to mitigate the far-reaching impacts. Existing global datasets are available at a very coarse spatial resolution (typically 50 km), limiting their application in local-scale studies. To address this limitation, we developed new high-resolution drought datasets (5 km) using high-quality datasets obtained from merging ground observation and remote sensing precipitation datasets, along with potential evaporation data, for the period 1981-2022.
The Climate Hazards Group InfraRed Precipitation with Station data version 2.0 (CHIRPS) and Multi-Source Weighted-Ensemble Precipitation version 2.8 (MSWEP) monthly precipitation datasets were utilized to develop the drought datasets, along with potential evapotranspiration data from the Global Land Evaporation Amsterdam Model (GLEAM) and hourly Potential Evapotranspiration. The cornerstone of our methodology is the Standardized Precipitation Evaporation Index (SPEI), a widely-used water balance model designed to identify wet and dry events based on the difference between potential evapotranspiration and precipitation data. The SPEI is a multi-scale drought index that enables the calculation of droughts for periods ranging from 1 to 48 months. Short-term droughts, such as those assessed using 1-3 months SPEI values, are particularly valuable for evaluating soil moisture levels and agricultural droughts. Conversely, longer-term droughts spanning 6-12 months provide insights into reservoir levels and groundwater availability. By employing SPEI across various temporal scales, our high-resolution drought datasets offer a comprehensive understanding of drought dynamics, allowing for targeted interventions and effective water resource management strategies.
|
SPEI categories for droughts |
SPEI values |
|
Moderately dry |
-1 to -1.42 |
|
Severely dry |
-1.43 to -1.82 |
|
Extremely dry |
< -1.8 |
(a) SPEI for March 1984 (Left) and SPEI time series for lat -0.86 and lon 19.32 (Right)
We have validated the datasets by developing additional drought indices such as the normalized difference vegetation index, vegetation health index (VHI), and vegetation condition index (VCI), along with existing datasets such as soil moisture. These new datasets are freely available from the Centre for Environmental Data Analysis (CEDA) and on JASMIN for researchers with access. JASMIN is a unique data analysis facility managed by the scientific community of the CEDA, providing researchers with access to a wealth of environmental data for analysis and research purposes.
Part 2: Applications:
These high-resolution drought datasets serve a multitude of purposes, empowering stakeholders to better understand and respond to drought events. Here’s how:
- Assessing the spatial and temporal variability and trends of drought events.
- Identifying hotspot areas for targeted intervention and resource allocation, enabling efficient disaster response and management.
- Monitoring trends in drought severity over time, providing early warning signals for potential drought emergencies and supporting proactive mitigation measures.
- Analyzing the interactions between drought, land cover, and land use, informing land management practices and ecosystem conservation efforts to enhance resilience.
(b) This is an example of the long-term trend in the 3-month SPEI per decade. The red colour indicates a decreasing SPEI, suggesting a drying trend, while the positive (blue) colour represents an increase in SPEI, indicating a wetting trend.
- Assessing the impact of drought on agricultural productivity and food security in vulnerable regions, aiding in the development of adaptive agricultural practices and policies.
- Supporting water resource management decisions, such as reservoir operations and drought contingency planning, to ensure sustainable water supply and management.
- Enhancing climate change adaptation strategies by identifying regions at high risk of increasing droughts, guiding targeted interventions and infrastructure development.
- Informing policy-making processes by providing scientific evidence on the magnitude and frequency of drought events, facilitating evidence-based policy formulation and implementation.
More information and data: Gebrechorkos, S. H., Peng, J., Dyer, E., Miralles, D. G., Vicente-Serrano, S. M., Funk, C., Beck, H. E., Asfaw, D. T., Singer, M. B., and Dadson, S. J.: Global high-resolution drought indices for 1981–2022, Earth Syst. Sci. Data, 15, 5449–5466, https://doi.org/10.5194/essd-15-5449-2023, 2023.
For any questions related to data, data access or collaboration opportunities please contact: Solomon Gebrechorkos (solomon.gebrechorkos@ouce.ox.ac.uk) or Simon Dadson (simon.dadson@ouce.ox.ac.uk)

