What’s the weather doing? It’s a question that obsesses many but for many Ethiopians it is question that makes the difference between plenty and destitution. Ethiopia is a rich and diverse country that is home to around 100 million people, 88 different languages and imbued with long, diverse history. Its highlands are seasonally wet and fertile and its lowland deserts are among the most parched places on Earth.
Dangila woreda, or district, is a hilly area in the north west of the country with a population of around 160,000 people spread across an area of about 900 km2. Although the area receives rainfall at around 1,600mm a year, over 90% of this falls between May and October. For farmers, who depend on livestock and rainfed crops, understanding and predicting these rains is crucial to their livelihoods. Traditional strategies, which have served for millennia, are coming under threat from new pressures of shifting climate patterns, land degradation and population growth.
Exactly what is happening now and what is likely to happen in the future is uncertain due to the lack of rainfall, river flow and groundwater level data. Throughout much of Sub-Saharan Africa, under-investment by governments has led to a widespread decline in environmental monitoring, and this in turn makes water resources management harder and harder.
But what if those who stood to gain most from better understanding and management of water resources were those leading the data collection? Can communities reliably collect accurate weather, river and groundwater data? This is the question that is being investigated by researchers, led by Newcastle University in the UK through a project called AMGRAF (Adaptive Management of GRoundwater for small scale-irrigation and poverty alleviation in sub-Saharan AFrica).
In a new paper in the Journal of Hydrology, David Walker and his colleagues explain why they think citizen science has a future in rural Ethiopia and beyond: ‘The benefits of community involvement in science are being slowly recognised across many fields, in large part because it helps build public understanding of science, ownership and pride in the results, and this can benefit both individuals and local planning processes. Because there are so few formal monitoring stations and such large areas that need to be understood and managed, we need to think differently about how data collection can be done.’
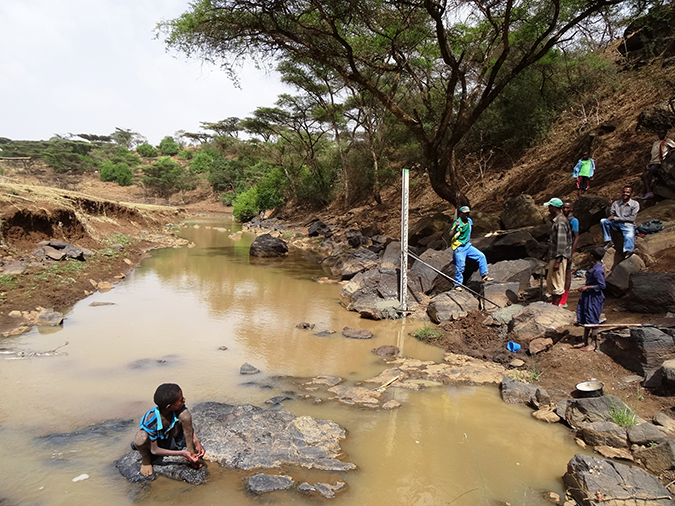
The community-based monitoring programme was started in February 2014 and residents of an area called Dangesheta were involved in the siting new rain and river gauges, and identifying wells that were suitable to be monitored. Five wells are manually dipped every two days, with a deep meter to measure the depth from the ground surface and the water level in the well; a rain gauge was installed in the smallholding of a resident who then took measurements every day at 9am; two river gauge boards were installed in the Kilti and Brante rivers and were monitored daily at 6am and 6pm. Every month, the volunteers would then give their hard copy records to the Dangila woreda government office, who then typed them into an Excel spreadsheet and emailed to the research team.
But is this data any good? For David and his colleagues, this was a critical question that could make or break the whole approach. The challenges of data validation are substantial, and there are generally two types of error:
Sampling errors come from the variability of rainfall, river flow and groundwater level over time and over area. The sampling error increases with rainfall and decreases with increased gauge density. A challenge in tropical areas, such as Ethiopia, is much of the rain is high-intensity thunderstorms, which can be quite short in duration and small in size, and therefore easy to miss, or only partially record, if the density of monitoring stations is low.
Observational errors are the second type, and can come from a number of things: wind turbulence, splashing around the gauge, evaporation can affect how much is in the rain gauge, and then the observer might not read the gauge accurately or make a mistake or unclear notation, when writing the measurement down.
‘Tracking down errors is tricky, but it can be done, mainly through statistical comparison with established monitoring stations and with each other’, said Walker.’What we found was that the community collected data is more reliable than that gathered through remote sensing instruments from satellites.’
It is hoped that this promising approach can attract further support and be used more widely, but what are the secrets, and challenges, to making community monitoring work?
‘People are at the heart of this process and selection of volunteers is crucial to avoid problems with data falsification or vandalism’, concluded Walker. ‘Feedback is absolutely vital and through workshops and meetings the data can be presented and analysed with the community so that they can make decisions on how best use the available rainfall, river flows, and groundwater to provide secure sources of water for their farms and their homes.’
Research continues with the help of one of our Catalyst Grants.

